Active funds vs index funds: what 10 years of data show
Active fund managers aim to beat the market. Long-term data show how rarely they succeed, and simple arithmetic explains why.
In short
- In the 10 years to mid-2026, 97 to 98% of active European, global and US equity funds denominated in euros trailed their benchmark.
- Among Swiss equity funds the figure was 89%.
- Almost a third of Swiss equity funds disappeared within those 10 years, merged or closed.
- Before costs, active investors earn the market return on average; after costs, they earn less. That follows from simple arithmetic.
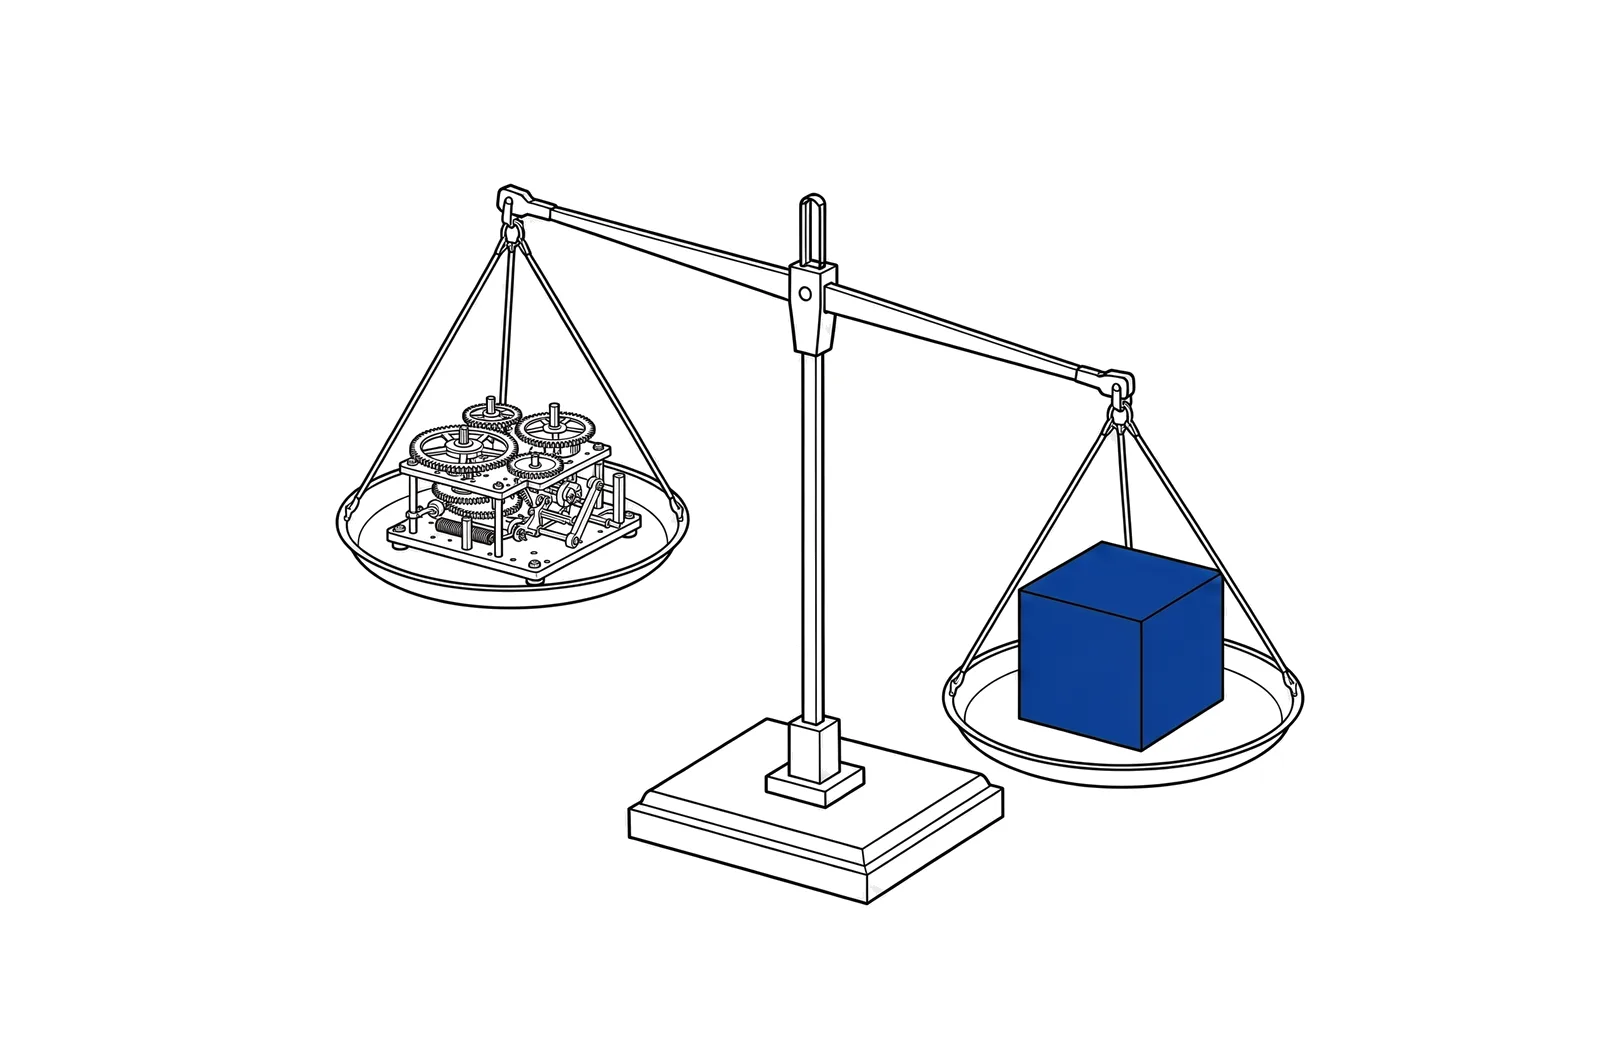
Twice a year, index provider S&P Dow Jones Indices measures how many actively managed funds beat their benchmark. The report is called SPIVA, and the latest European edition covers data to the end of June 2026. Every fund counts equally, and funds that closed along the way are included.1
The numbers
Share of active equity funds that trailed their benchmark, to the end of June 2026:1
| Category | 1 year | 5 years | 10 years |
|---|---|---|---|
| Swiss equity | 87% | 90% | 89% |
| European equity (EUR) | 87% | 94% | 97% |
| Global equity (EUR) | 72% | 95% | 98% |
| US equity (EUR) | 70% | 96% | 97% |
| Emerging markets equity (EUR) | 39% | 74% | 88% |
In most categories, the longer the period, the clearer the picture. Over one year, about 61% of emerging markets funds beat their index; over 10 years, only 12% did.1
Many funds disappear
Of the 184 Swiss equity funds that existed in mid-2016, only 70% were still around ten years later. For European equity funds it was 57%. The rest were merged into other funds or closed. According to S&P, this usually follows a period of poor performance.1 If you only compare the funds on offer today, you get a picture that looks too good.
Why this happens
In 1991, economist William Sharpe showed why active investors on average must trail the market, however skilled some of them are. All investors together own the whole market. Passive investors earn exactly the market return before costs. So all active investors together must also earn the market return before costs. After costs, the average actively managed dollar must therefore trail the average passively managed one.2
Individual active funds can beat the market. On average, though, the difference in costs eats up any edge. A Morningstar analysis points the same way: of the cheapest fifth of US equity funds, 62% survived and beat their category peers over the five years to 2015; of the priciest fifth, only 20%.3 Our article on fund fees shows how much even half a percent in fees adds up to over decades.
What this means for you
If you own an active fund, measure it honestly against its benchmark, over at least 10 years and after all costs. If it keeps falling behind, you are paying for something you are not getting. A broad index fund, by contrast, delivers almost exactly the return of its index, minus its usually low costs.
Fee calculator
| After | A | B | Difference |
|---|---|---|---|
| 5 yrs | CHF 12,462 | CHF 12,702 | CHF 240 |
| 10 yrs | CHF 15,530 | CHF 16,134 | CHF 605 |
| 20 yrs | CHF 24,117 | CHF 26,032 | CHF 1,915 |
| 30 yrs | CHF 37,453 | CHF 42,001 | CHF 4,548 |
Simplified: the same return every year, costs deducted directly from the return, savings at the end of each month. Before taxes and inflation.
Your entries stay in this browser only.Open as its own page
Put it into practice
0 of 4 done
What we don’t know
- Past data do not show how active funds will perform in future.
- A benchmark index costs nothing, but a fund that tracks it does. Index funds therefore also trail their index slightly.
- The report does not explain why the share is lower for Swiss equity funds than for European or global funds.
- Written by
- Roman, Publisher
- Published
Two articles a week
Health and money, checked and read in five minutes.